

Impact Dashboard
The Impact Dashboard is the main screen in the 1ClickImpact app. It gives you a complete overview of your store's environmental contributions, daily trends, and individual impact records.
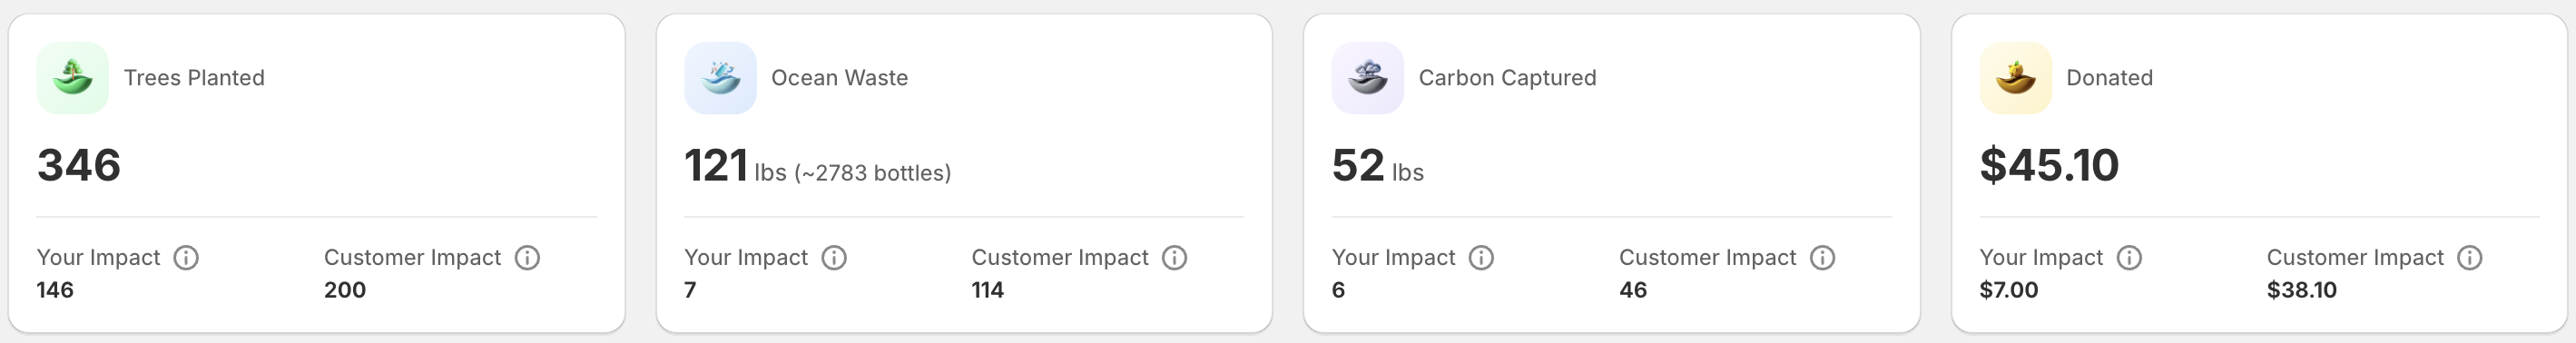
Total impact overview
At the top of the dashboard, you see your store's cumulative impact totals displayed with icons for each category:
- Trees planted — Total trees planted (regular and food trees)
- Ocean waste removed — Total pounds of plastic removed from oceans
- Carbon captured — Total pounds of CO₂ captured
- Money donated — Total amount donated to causes
These numbers update in real time as new orders are processed.
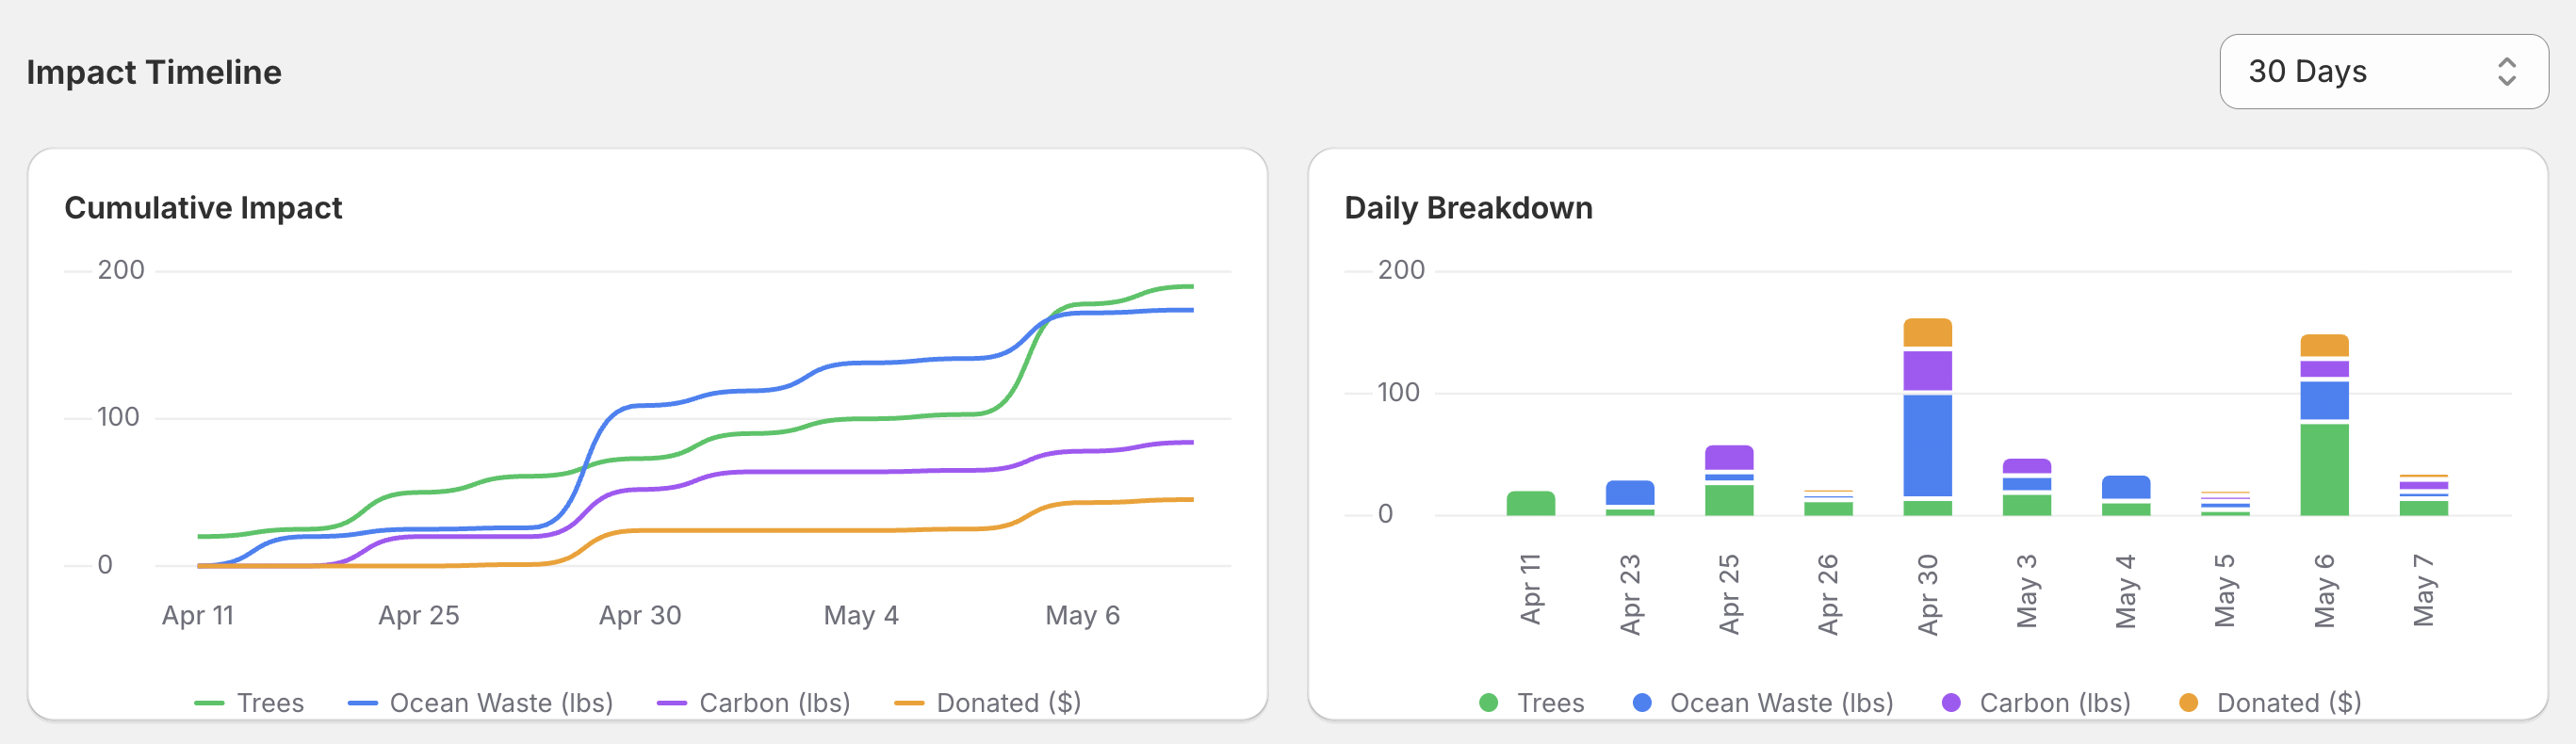
Daily impact chart
Below the totals, a bar chart shows your daily impact over the last 30 days. Each bar represents one day's total contributions across all categories. This helps you spot trends, see the effect of promotions or sales events, and track your store's impact trajectory.
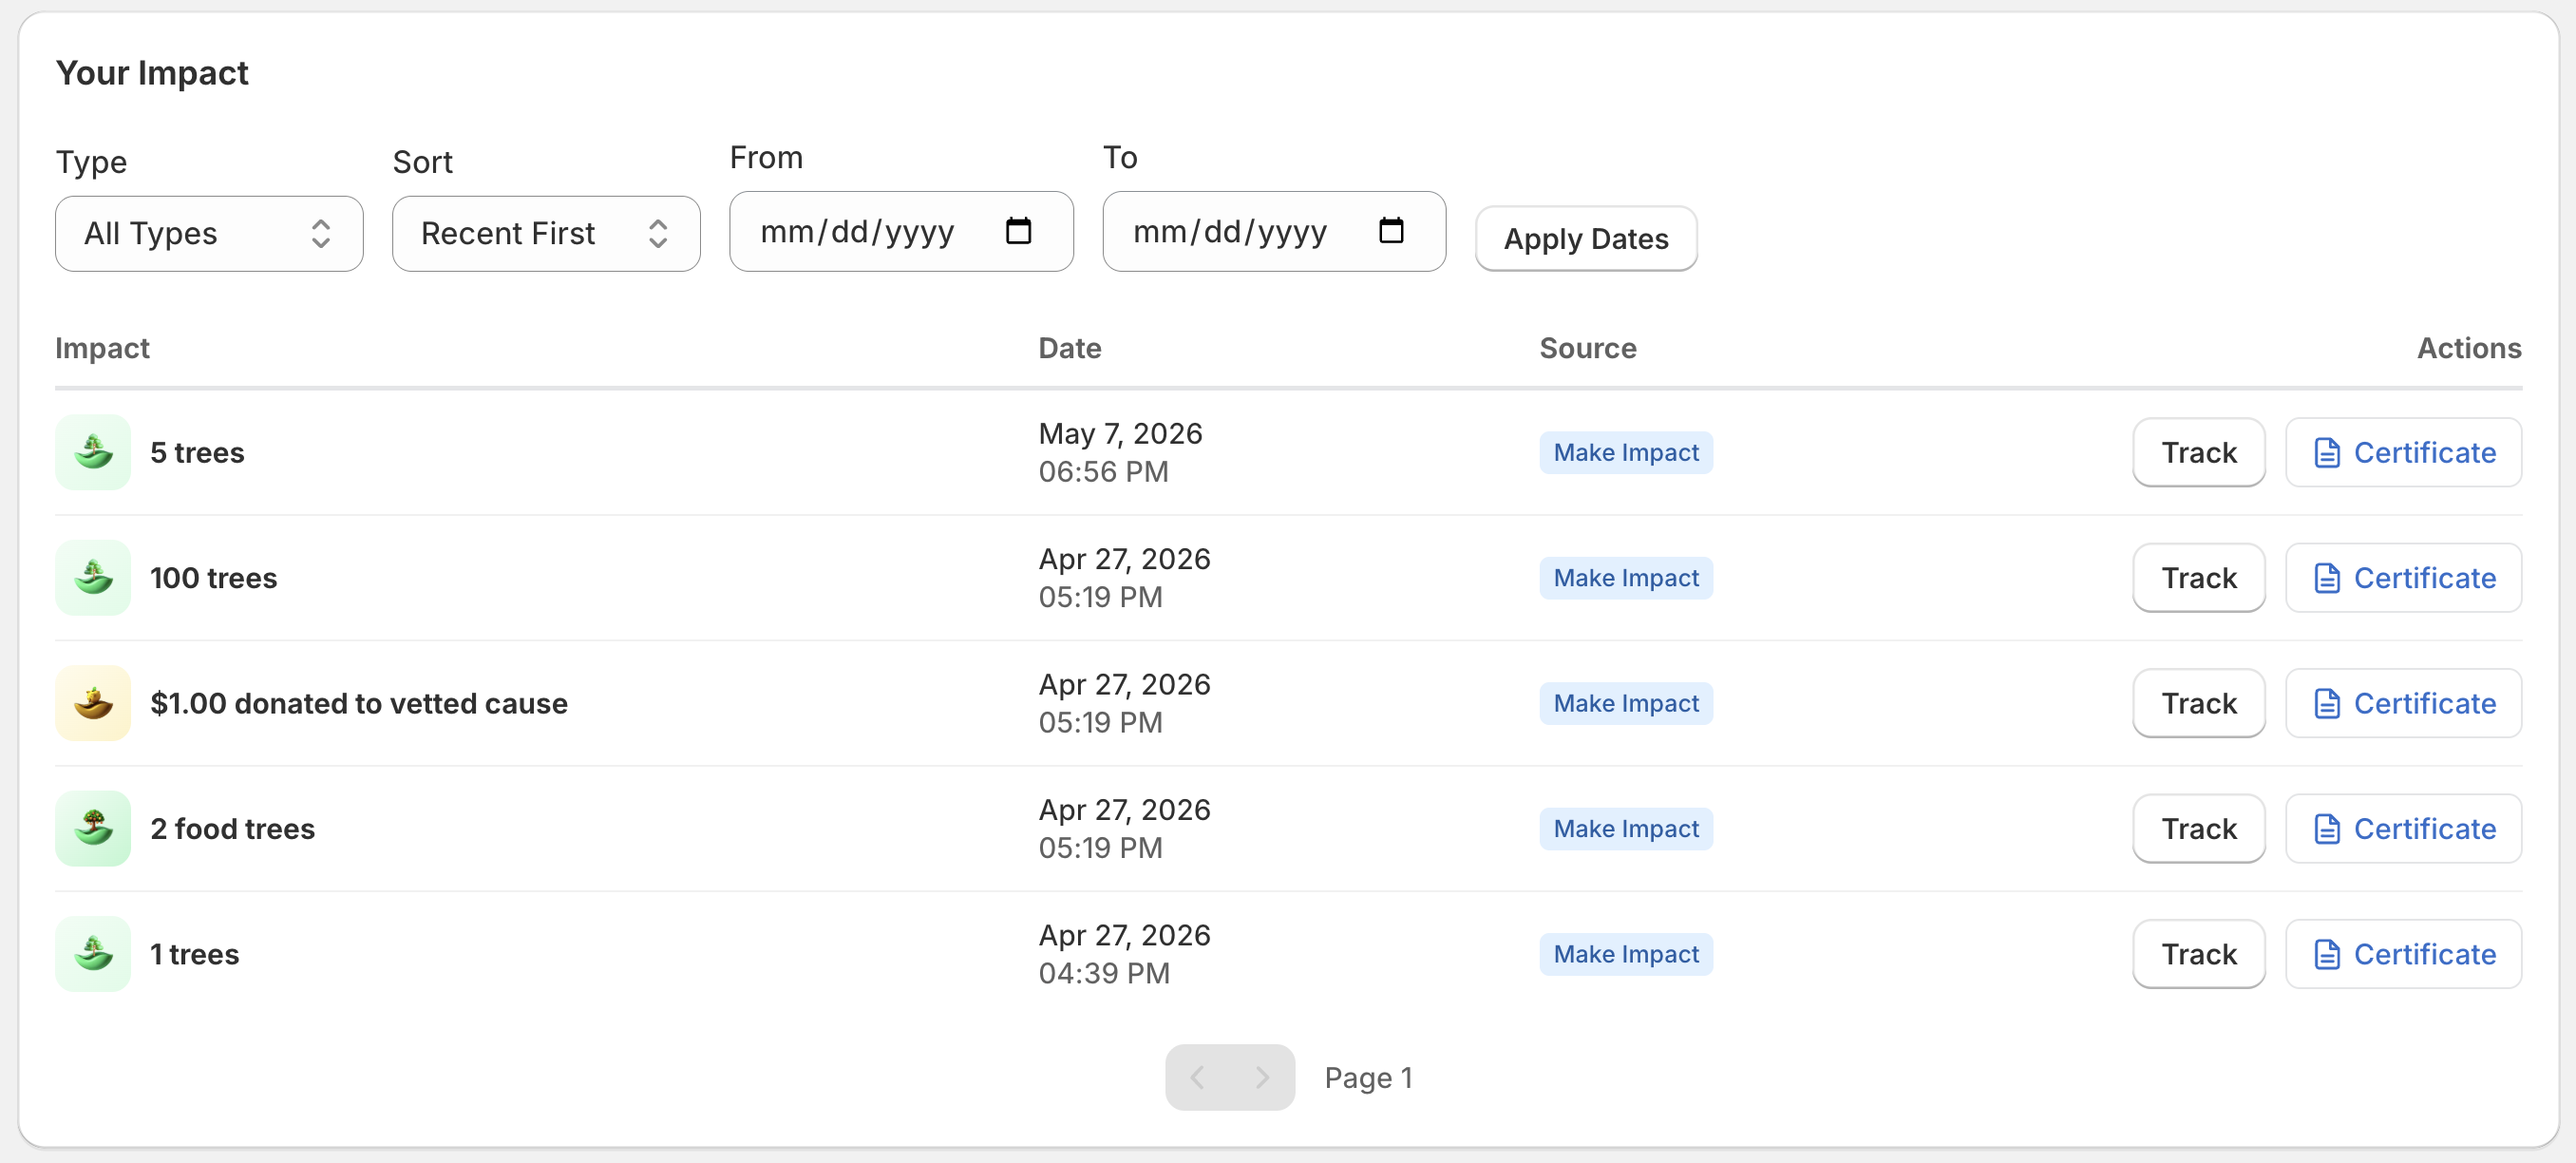
Records table
The records table lists every individual impact event. Each row represents one processed impact and includes:
- Order number
- Date and time
- Impact categories and quantities
- Customer information (if applicable)
Search and filtering
You can search records by order number or customer name. Filters allow you to narrow results by:
- Impact category
- Date range
Pagination
Records are paginated for performance. Use the navigation controls at the bottom of the table to move between pages.
Record details
Click any record in the table to open a detail view showing:
- Full tracking information for the impact
- Certificate links
- Partner details and location (with Google Maps embed)
- Impact lifecycle timeline (Initiated → Received → Transferred → Completed)
- Live planting session links (for food trees)
- Video recordings of the impact
For more details on how tracking and certificates work, see Tracking & Certificates.
The dashboard shows both test orders and real orders. If you placed test orders during setup, they will appear in the records table alongside production orders.
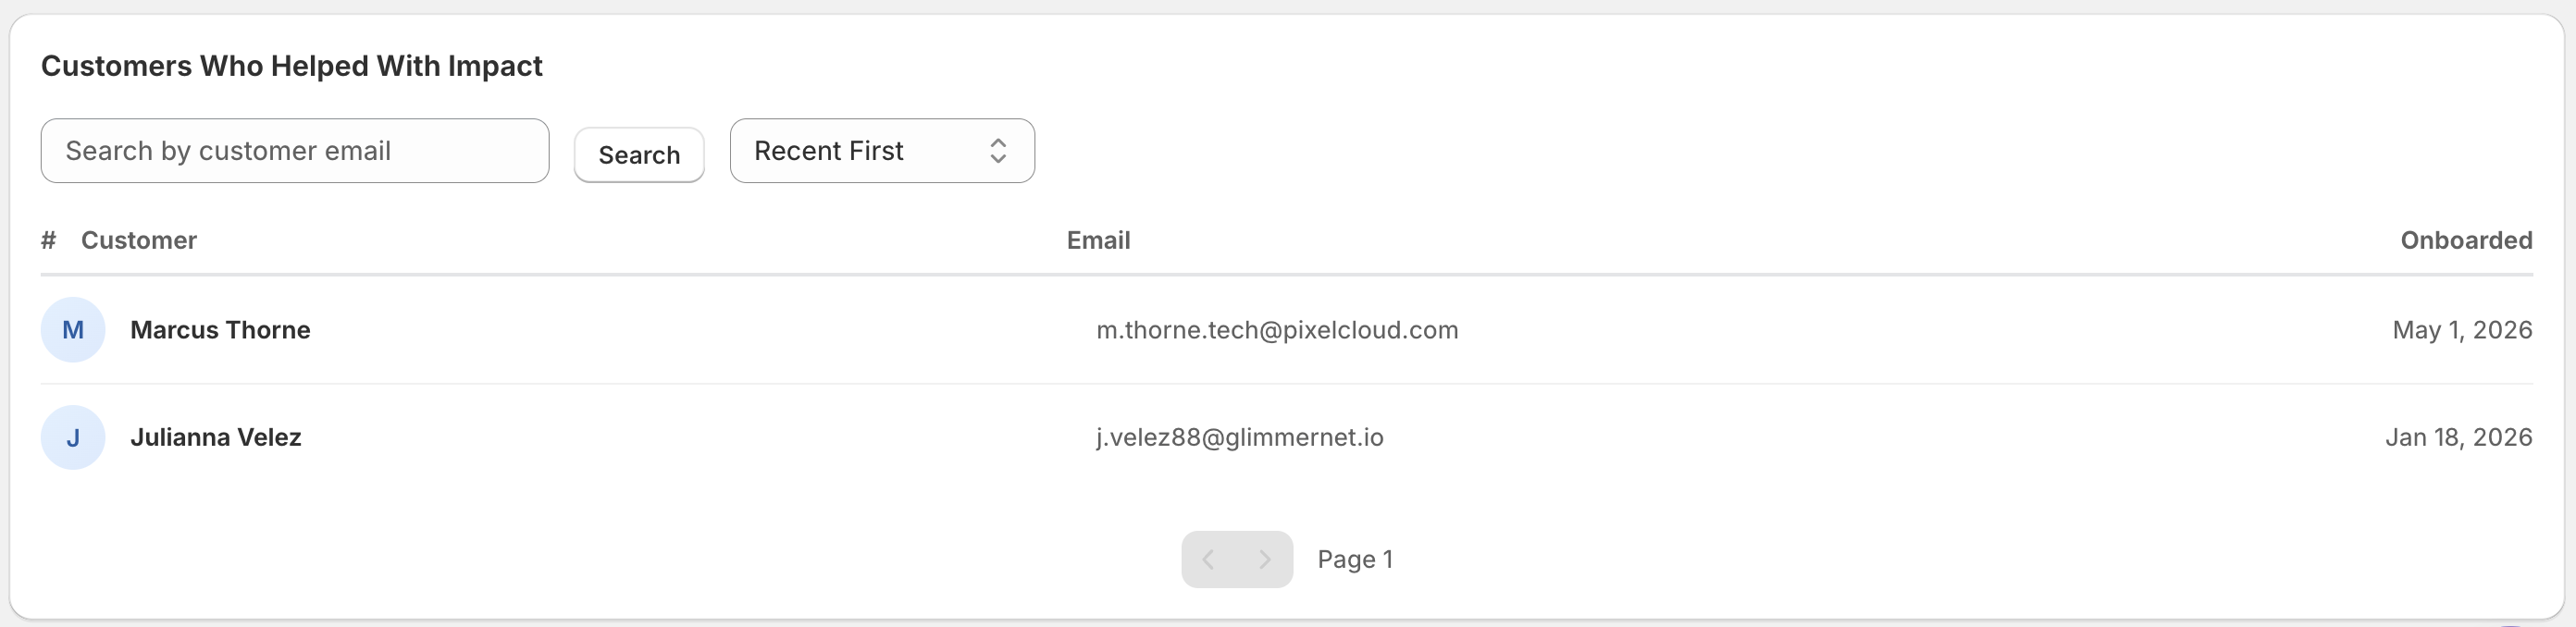
Customer impact tab
The dashboard includes a separate Customers tab that gives you a complete view of every customer who has generated environmental impact through your store.
Customer list
The customer table shows:
- Email address — The customer's email from their Shopify order
- Total impact — A summary of the trees planted, ocean waste removed, carbon captured, and donations made by or for that customer
- Onboarded on — The date when the customer first made an impact
The list is sorted by most recent activity by default, so your most active customers appear first.
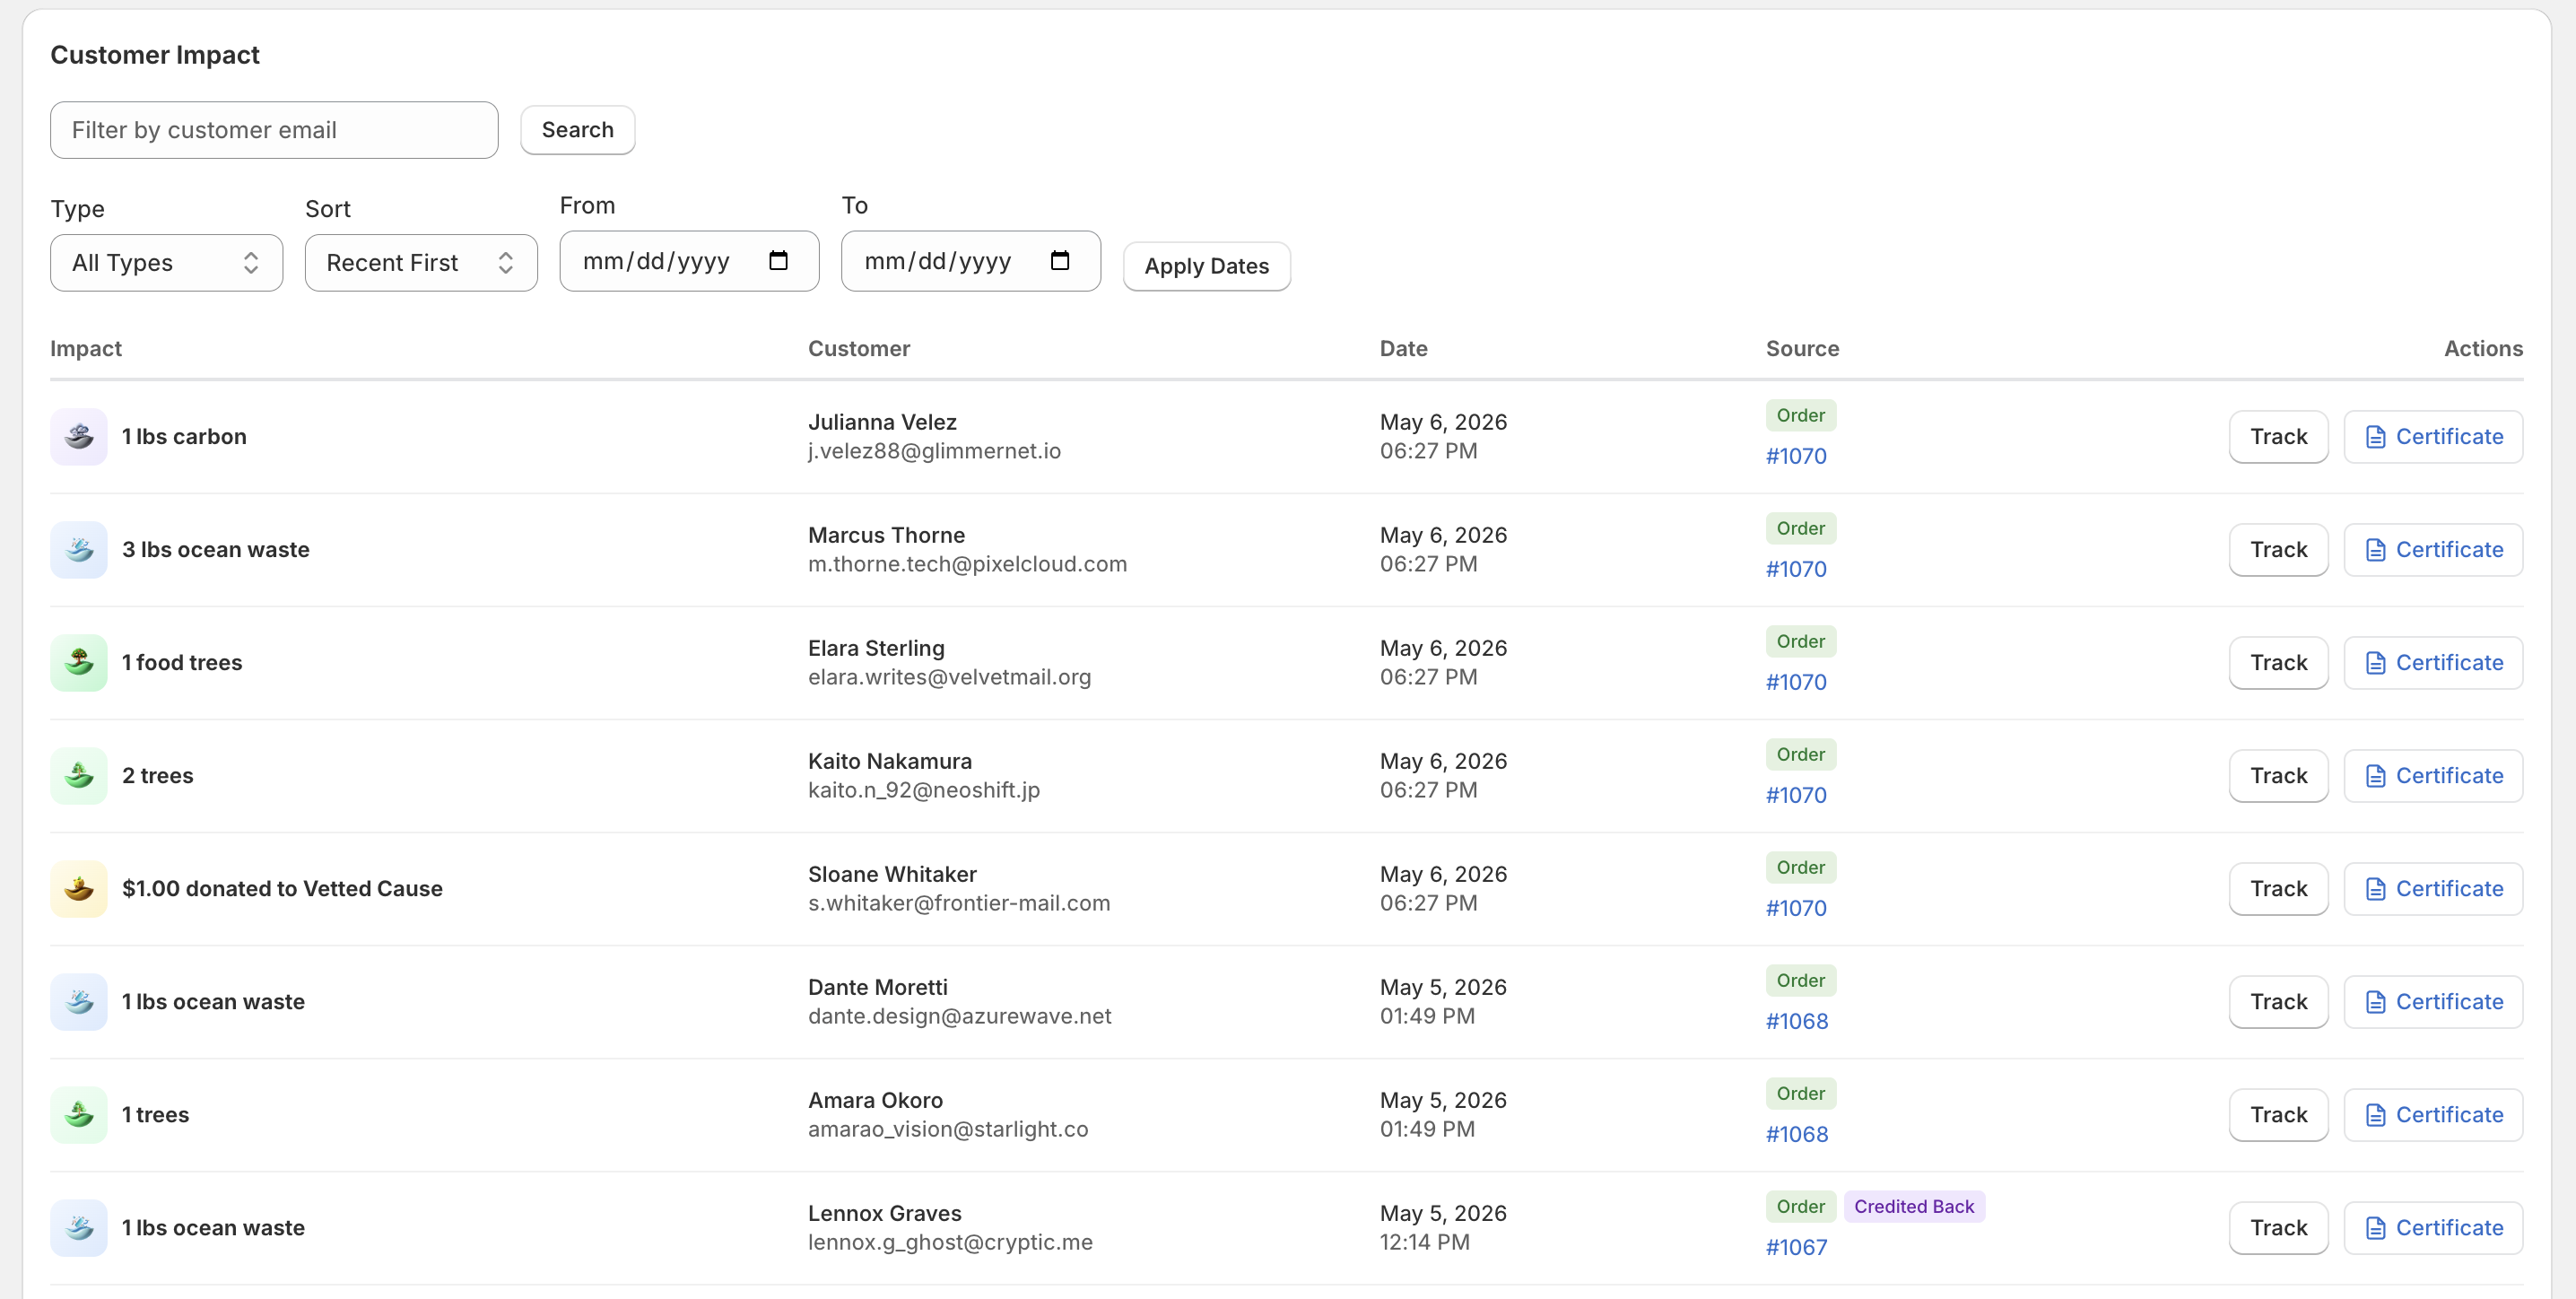
Viewing individual records
Click on any customer row to open their detailed impact history. This view shows every impact record associated with that customer, including:
- The date and order number for each impact event
- The specific categories and amounts triggered (e.g., 2 trees, 1 lb of ocean waste)
- Source of impact — whether it was merchant-funded using Make Impact or Monthly Impact, part of an order placed, or whether the impact was cancelled and credits were issued back
Merchant vs. customer impact
The dashboard tracks two types of impact:
- Merchant impact — Impact that is not tied to a specific order or customer. This includes impact created from the Make Impact page and impacts from the Fixed Monthly trigger mode.
- Customer impact — Impact tied to a customer purchase. This includes all impacts from per-order and per-product triggers, as well as Customer Add-on Products that customers add to their cart.
Both types are displayed in the totals and clearly labeled in the records table.
Customer add-on impacts count against your monthly budget. If the budget is exceeded, all impact processing (including add-ons) is paused until the budget is increased or resets.